Email best practices
Email marketing metrics: What do they tell you?

In the mind of many marketers, emailing is mostly about having a contact list, coming up with engaging content ideas (from the subject line to CTAs), and pressing send with the satisfaction of a job well done. Yet, funnily enough, this is just half of the job. There is more to email than just sending campaigns or setting up transactional emails. It’s also about tracking your campaigns’ performance, analyzing the results, and drawing conclusions to improve your future sending. “But how do I do this?“ we hear you ask.
Fear not, dear reader! Email marketing metrics (and your marketing expert friends from Sinch Mailjet) are here for you. In this post, we’ll walk you through the stats you should keep an eye on, why they are important, what the results can say about your emailing practices and overall marketing strategy, and how you can improve them.
Measure your email effectiveness with these metrics
Obviously, all email statistics provided by the different email service providers are relevant. They’re actually so relevant that, whatever platform you’re using to send your emails, the different email metrics available in your reporting dashboard are labeled the same way. Yeah, email stats are that important.
Common email marketing metrics
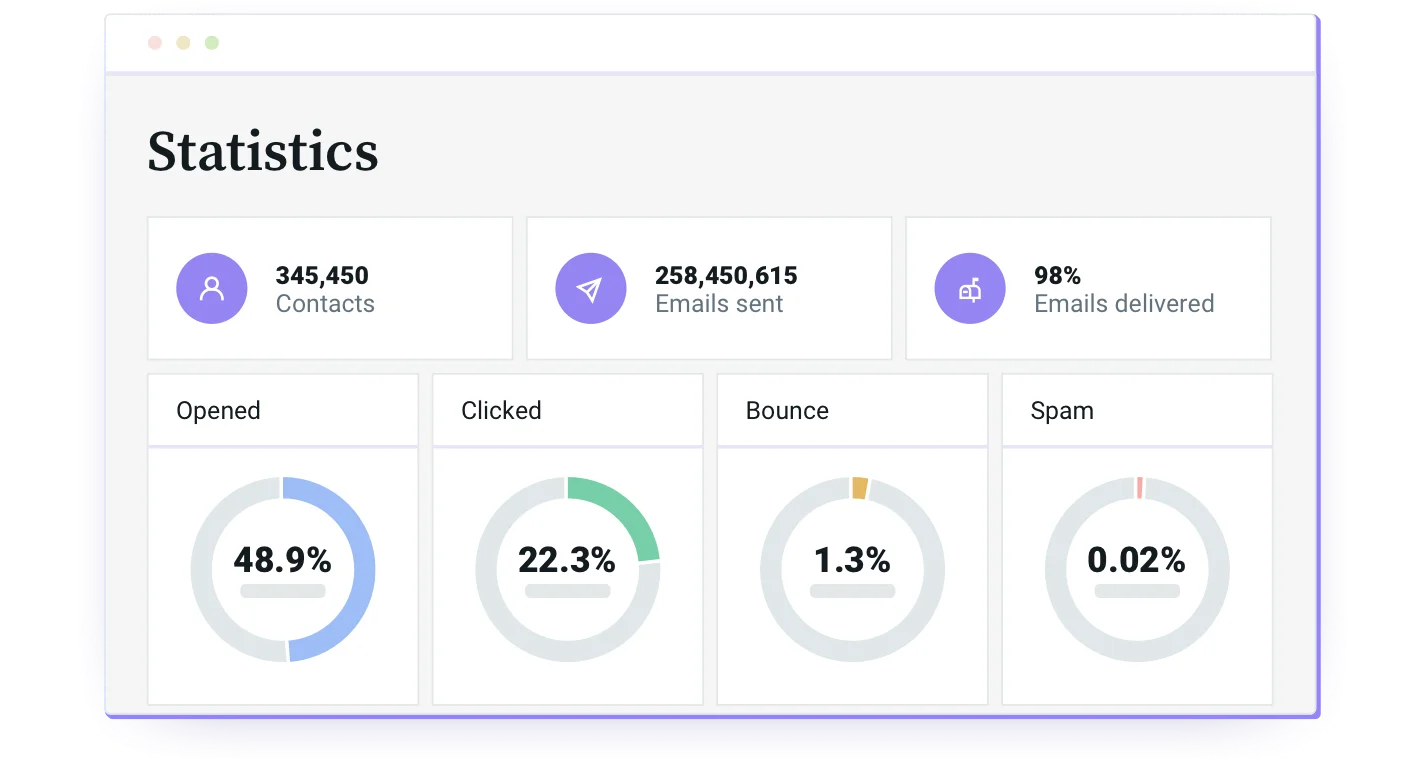
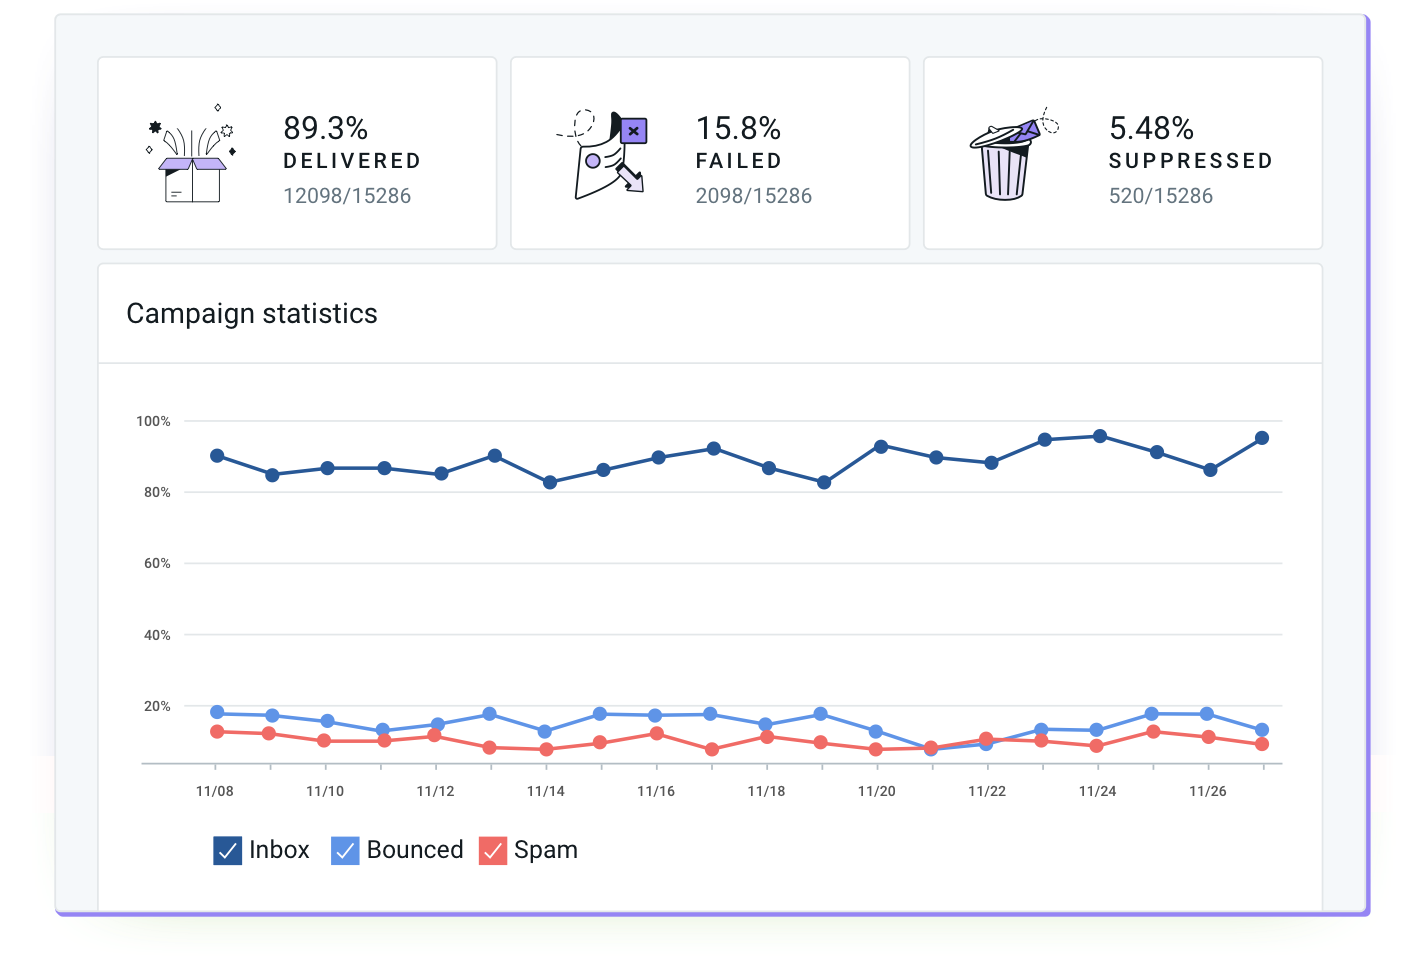
Let’s not get carried away – before we can interpret stats or measure our ROI, we need to understand the fundamentals of email metrics. When you look at your email reporting dashboard, you will see a timeline with your campaign’s performance metrics. From here, you can monitor everything at a snapshot and filter down to specific stats.
Let’s walk through each of these labels and understand how they work.
Sent and delivered
These are the most obvious and easy to understand email metrics– the sent and delivered rate. Their names are pretty straightforward. The sent rate is the proportion of emails that have actually left the sender server to reach your recipients. Suppose large numbers of messages stay as Sent for a long period of time (usual sending time may vary between a couple of seconds to a few hours). In this case, you are probably experiencing a deliverability issue.
The delivered or email delivery rate is the proportion of sent emails that have landed in the recipient’s server. However, being Delivered does not necessarily mean the email ended up in the recipient’s inbox. It’s impossible for anyone other than the recipient to know if the message was delivered to their inbox or the junk folder.
Usually, if you’re respecting email best practices, these stats are somewhere between 95% and 100%.
Open rate
The open rate is the percentage of delivered emails that have been opened at least once. It’s a good way to know if people want to read your emails or if they bin them straight away without even opening them. You clearly want this stat to be as high as possible.
Email open rates have faced some scrutiny of late after Apple made sweeping changes to how we track opens in Apple Mail. Now the dust has settled, the consensus within the email community is that open rates should be taken with a pinch of salt. Instead, marketers should focus on alternative metrics like click-through rates (CTR).
Click-through rate
The click-through rate or CTR is the percentage of opened emails that have been clicked on at least once, excluding clicks on the unsubscribe link. This statistic is very important as it shows how email subscribers interact with your content and if it is interesting enough to drive readers to your website. High click rates are a sign of interest and can help shape your future email marketing campaigns.
Bounce rate
The email bounce rate is calculated on the total amount of emails sent. A bounce means that the email didn’t reach its intended destination – your contact’s inbox – for different reasons, and it was returned with an error message. At Mailjet, we make a distinction between soft bounces and hard bounces.
Soft bounces are temporary issues, such as the recipient’s inbox being too full or there is a connection timeout. In these cases, redelivery will be attempted automatically. If the email is not delivered within five days, it’s marked as a hard bounce.
Hard bounces are permanent delivery errors caused by an invalid email address (e.g. a mistyped email, a non-existent destination server, etc.). These types of bounces negatively impact your sender reputation. To avoid deliverability issues, it’s very important to regularly remove bounced email addresses from your contact lists.
Unsubscribe rate
The unsubscribe rate is linked to the open rate. It indicates the percentage of recipients who clicked on the unsubscribe link – or the unsubscribe button provided by some webmail clients and ISPs – in the open email. Think of it as a healthy way to keep your contact lists up-to-date. Note that, if you’re using Mailjet, unsubscribed email addresses are automatically removed from your lists.
Block rate
The block rate is calculated on the total amount of emails sent. Blocked is a status Mailjet sets for its users. Emails that have previously hard bounced, have been marked as spam, or have potential spammy content are pre-blocked by our system. This way, your sender’s reputation is less impacted.
Spam rate
This stat is also calculated on the total number of emails delivered. Spam complaints are made when the recipient believes an email is unsolicited. Spam is typically aimed at marketing emails. Transactional emails usually don’t get marked as spam. Many ISPs provide a “spam” button or link in each email delivered. When a recipient clicks on this button, the email is reported as spam and this is displayed on your Statistics Dashboard.
Spam complaints are taken very seriously and can be detrimental to your sender reputation or spam score. You will want to keep your spam rate lower than any other email metric.
Some tips in our Acceptable Use Policy to keep your spam rates down are:
- Only send your emails to recipients who have given explicit consent. The use of third party contact lists is prohibited.
- Always include a clearly visible and easy-to-use unsubscribe link in all your emails. You don’t want subscribers to mark your email as spam to stop receiving it.
- Your sender name and domain must be communicated in all your messages. Content should be relevant and reflect your subscribers’ expectations. Cleaning your lists regularly ensures that your emails are sent to engaged readers.
|
Statistic Thresholds |
Acceptable levels* |
Additional details |
|---|---|---|
|
Bounces |
≤ 5% |
Calculated on the number of messages that have bounced |
|
Unsubscribes |
≤ 1.4% |
or 1% if unsubs > clicks |
|
Spam Complaints |
≤ 0.08% |
Calculated on the number of messages that have been reported as spam |
Mailbox providers, devices, and browsers
There are many combinations of ways your readers are viewing your email content. Perhaps they are using an iPad, a Chrome browser, and Yahoo mail. Or an Android phone with the in-built Gmail app. How about a PC on the Edge browser running Live? You get the gist.
Knowing how your audience views your emails might explain why you’re seeing a sudden lack of engagement. A user is unlikely to engage with your content if it’s formatting incorrectly. If you identify low engagement with an email client, you can use deliverability software like Email on Acid to visually understand what is going wrong.
Interpreting your stats
These stats don’t exist for the sake of our love for numbers. They mean something. And following the results, you should take different actions, depending on the KPIs you have set. Let’s go through a few common scenarios:
My open rate is low
Before opening your emails, your recipients will check three things: your sender name, subject line, and pre-header. Have you tested these different elements? The sender name you’re using might not be as clear as you think. Or perhaps your subject line could use some puns.
Not sure where to start? Try A/B testing these three elements to discover what your audience responds well to.
My click rate is not taking off
Great! Your recipients open (and hopefully read) your emails. Though, for some reason, they don’t seem to click. This could be down to either a call-to-action (CTA) or a content issue. If there are not enough things to click on in your email, your readers might not click. Or if your content isn’t appealing enough to them, your readers won’t click.
So be sure to test (yep, once again) the positions of your CTAs and the length of your content. Make your CTAs more clickable, with clear buttons and/or images instead of simple hyperlinks in your wording. This is also practical: if your emails are opened and read on a mobile device, it will be easier for readers to click on a button using their thumbs rather than having to zoom in to enlarge the text.
My email performance metrics have dropped significantly
It can be alarming when, all of a sudden, your email stats start to take a nosedive. The good news is there’s no smoke without fire when it comes to email marketing.
Reasons for suddenly dropping stats:
- You haven’t sent an email for a long time, and your recipients don’t know who you are anymore.
- You recently purchased or borrowed a third-party list (huge no-no!) and are currently experiencing the consequences.
- Since you started sending emails regularly, you haven’t cleaned your contact list, resulting in a clog of bad stats.
The golden rule of email marketing is never to use a purchased contact list. It damages your sender reputation, resulting in inbox providers sending your emails to spam folders and drastically hurting your campaign results. A quick win is never worth a long-term loss.
Now that we’re sure you know and remember the golden rule, there are a few other things you can do. If it’s the first campaign you’re sending for quite a long time, send smaller campaigns before you send to all your contacts, and ask them if they want to stay on your subscriber list or not. This way, you’ll limit the risks of your unsubscribe and spam rates skyrocketing.
Also, don’t forget to remove bounced, reported as spam, and blocked emails from your contact lists. It’s like cleaning your teeth each night – it takes just three minutes of your time, it’s kind of annoying, yet in the long run, the results are worth it. You still have all your teeth and preserve your sender reputation. Everybody (but your dentist) wins!
Uncovering more insights with advanced stats
Okay, now we have covered the basics, let’s explore advanced statistics that require some extra legwork. Unlike the previous stats, which we can find easily in our email reporting dashboard, advanced stats require a combination of link tracking and some mathematics. Back to school it is then!
Conversion rate
As marketers, we want our audience always moving down the funnel towards a sale until they become customers. We want to convert readers to subscribers, subscribers to leads, and leads to sales. So every step on that customer journey is called a conversion.
According to Inbox Insights 2022, best-in-class marketers see conversion rates are the most effective way to measure email performance. And who could argue? Your customers have intentionally clicked through from your email and performed a desired action. Examples of conversions include:
- Making a purchase
- Starting a free trial
- Filling out a data capture form
- Leaving a review
- Renewing a subscription
Tallying up these conversions is crucial to understanding the effectiveness of your email marketing strategy. The math sum is elementary my dear:
Spreadsheets (while not for everyone) are a great way to quickly use and replicate equations used for advanced stats without having to work them out each time manually.
Click-to-open rate
Open and click rates are pretty straightforward, so what on earth is a click-to-open rate (CTOR)? And why do marketers consider it such a valuable metric? CTOR combines the two highest engagement metrics together: opens and clicks. By cutting out the large percentage of uninterested readers, we can focus on how our content is received by our engaged audience.
Let’s demonstrate this:
You send 1,000 emails and 10 people click on links. Therefore, your click rate is 1% – which looks like your content is underperforming. You send 1,000 emails, 100 people open and 10 people click. Your CTOR is 10%, not bad – It turns out that your content is actually performing well after all.
What makes CTOR even more accurate is that we are only calculating the unique opens and clicks. This cuts out double opens or multiple clicks on the same CTA.
Here’s how we calculate a CTOR:
Share forwarding rate
Word of mouth is the quickest and most cost-effective way to win a new customer’s trust. Therefore, social media shares are worth measuring and continually improving. However, you will first need to use UTM tagging for your campaign social share links so we can measure just how many people may have shared your email. Then, we use this simple formula to create a percentage rate:
List growth rate
Ideally, you want your contact list to grow steadily throughout the year. It’s a good signal that your marketing strategy is working and people are engaging with your content. If your growth rate starts to decline, you can begin to investigate why or take steps to build your email list.
Here’s the formula to calculate your growth rate:
Use this equation during a fixed sending period, such as a week or a month, and create a bar chart for a better visual representation of your data.
Engagement rate
Once your subscribers have opened your email, there are some pretty clever tools to drill down into how long they have spent reading your content. The reading duration is a key sign of how valuable your readers find your content. Tools like Email on Acid’s analytics offer three engagement thresholds:
- Glance/delete: Email open for 2 seconds or less
- Skim: Email open for 3 to 7 seconds
- Read: Email open for 8 seconds or more
Circling back to device stats, you can also see the engagement figures for each browser environment. You’d be surprised at the impact that surfing on desktop, web browser, or mobile has on your engagement numbers. Someone on a mobile that encounters a wall of text might be more likely to glance at and delete your email. How would that impact your future design choices?
Measure your ROI with these stats
We know by this point that email has the highest return on investment (ROI) of any digital marketing channel – $35 – $40 for every $1 spent to be (almost) exact. To determine if our marketing efforts live up to this lofty benchmark, we need to gather our expenses and combine them with conversion metrics.
Email marketing expenses can include:
- Email platform costs
- Other SaaS providers
- Staff hours or agency fees
Using our UTM tracking and Google Analytics data, we can extrapolate email interactions that led to a sale. Choosing an attribution model will determine how strictly you associate an email’s influence with a sale. While email ROI can quickly become complex, here we’ll cover the simple calculation:
Mailgun has a pretty handy online email ROI calculator where you can quickly generate some figures – give it a go. Or, if you want to dive deeper into calculating email ROI, check out our post “How to calculate email marketing ROI”.
In conclusion
And here we are. We’ve walked through the main stats you should follow when looking to improve your email campaigns. As you’ve seen, it’s not rocket science, but simply testing, improving, and testing again. Oh, and of course, following best practice (you haven’t forgotten the golden rule yet, have you?).
Did you like the post, or have something to add to it? Let us know on Twitter! We’d love to hear about your metrics, let us know.
***
This blog post is an updated version of the post “What Do Your Stats Tell You? Emailing Doesn’t Stop When You Press Send!“, published on the Mailjet blog on March 23rd, 2017 by Thomas Hajdukowicz.