Chapter 04
Measuring inbox placement

Chapter 04

Email marketing metrics can tell you a lot about campaign performance, what your subscribers like to engage with, and what convinces people to convert. There are also specific stats that help you track and monitor deliverability.
The problem is – many people who send emails to customers and contacts fail to understand what this data truly means for the health of their email programs. In fact, 88% of the senders we surveyed couldn’t correctly identify what the delivery rate measures.
In this chapter, we’ll clear up the confusion.
say they are actively monitoring the delivery rate metric.
could not correctly identify what the delivery rate measures.
say they are not using inbox placement reports to test deliverability.
are unable to classify hard email bounces or are unsure if they can.
When we asked participants to select all the metrics they actively monitor to measure deliverability, these were the top five results:
1. Open and click rates (57.4%)
2. Delivery rate (53.1%)
3. Bounce rates (46.5%)
4. Unsubscribe rate (39.5%)
5. Spam complaints (32%)
Every one of these options provides information about deliverability. Some can signal potential problems with mailbox providers, others suggest you need to adjust your strategy or conduct list hygiene. There are three main areas for these deliverability metrics:
Spam complaint thresholds
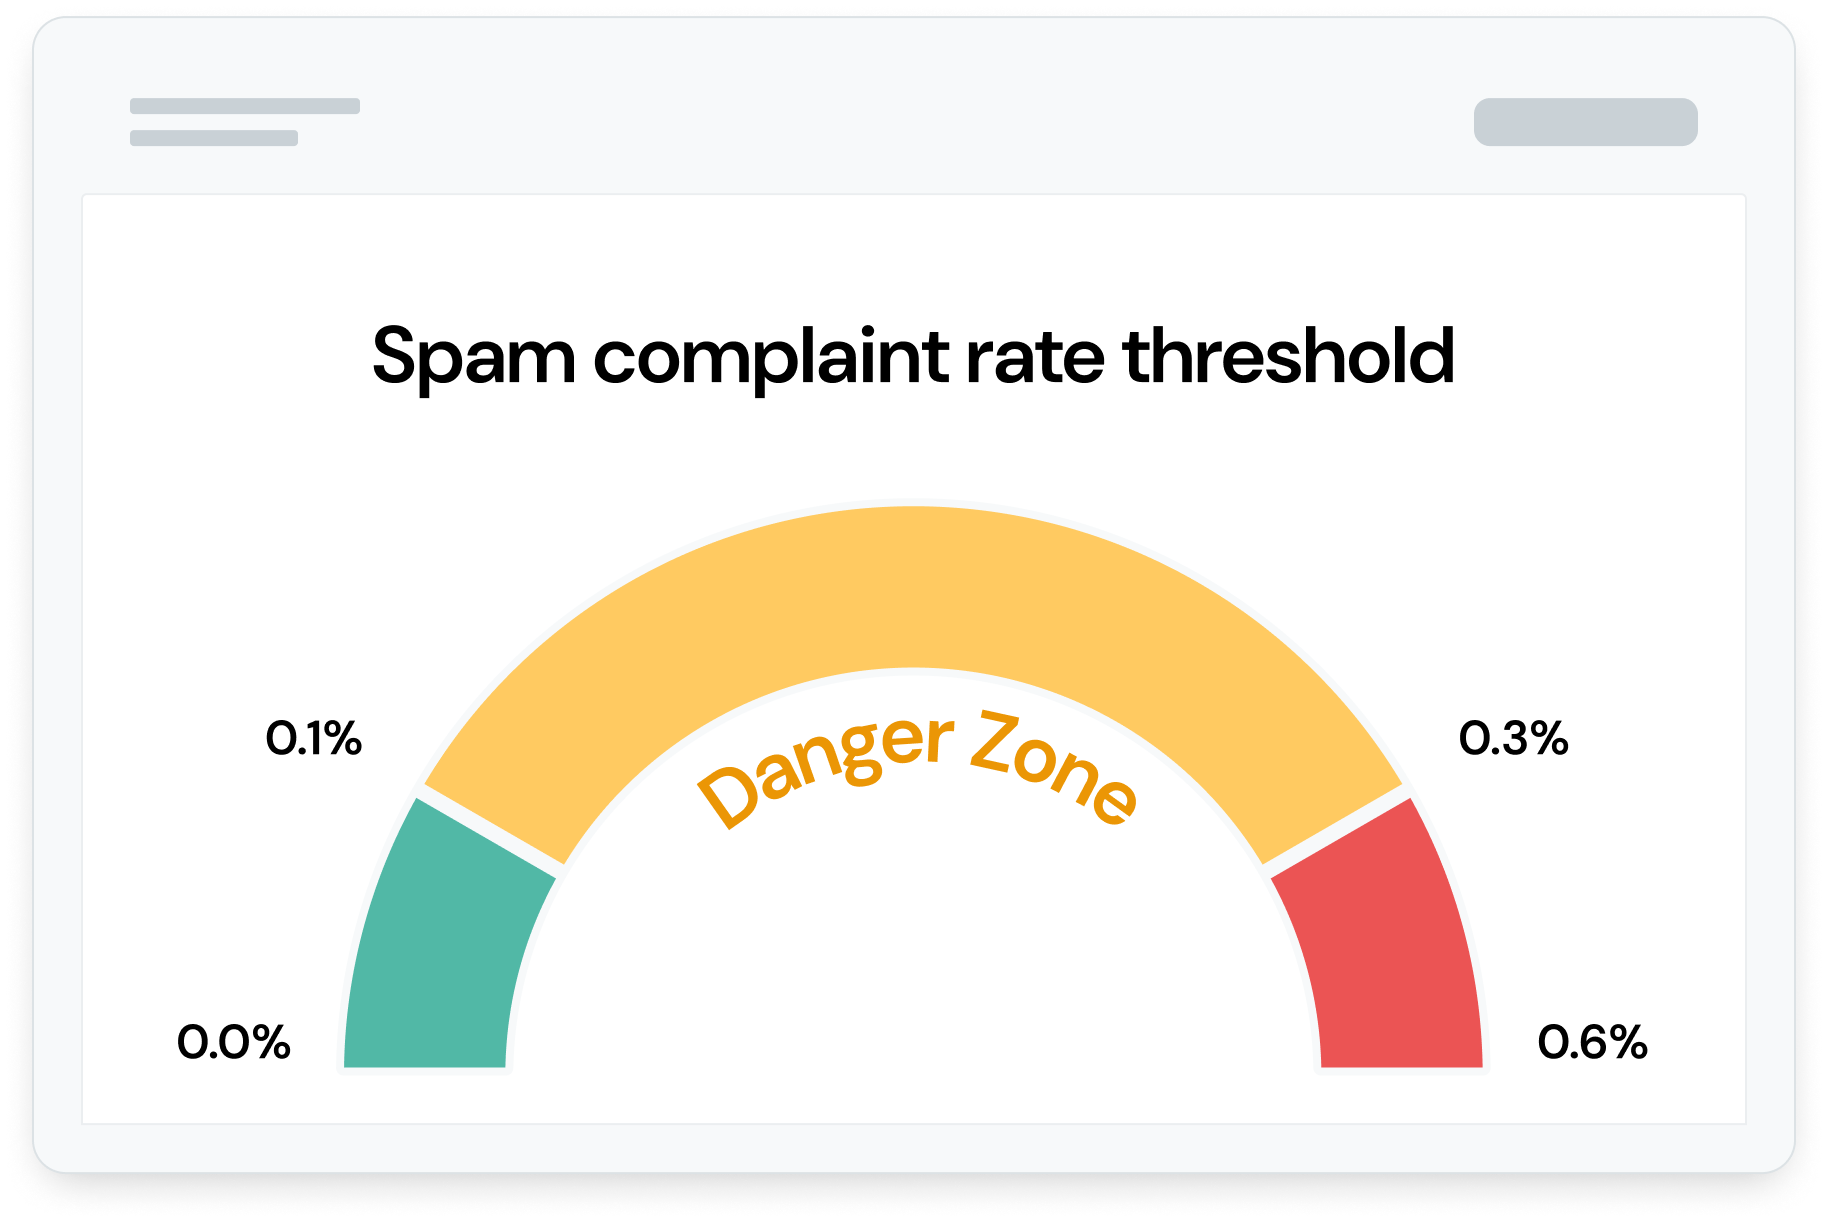
Sender requirements call for spam complaints to stay below 0.1% without ever reaching spikes of 0.3%. If you hit the 0.3% threshold, mailbox providers will view you as a spammer. Senders in between 0.1% and 0.3% should adjust sending practices to reduce complaints.
The open rate and click rate are important engagement metrics you should strive to improve or maintain to support deliverability. A gradual decline in engagement may indicate you need to conduct list hygiene. A sudden, unexpected decrease in opens and clicks could also mean a mailbox provider is blocking your emails.
More than 57% of respondents actively monitor opens and clicks. However, only 32% say they actively monitor their spam complaint rate. User-generated spam complaints are a negative engagement signal with a more immediate impact on deliverability.
In 2024, Google and Yahoo announced specific thresholds for spam complaints. If a sender exceeds the threshold, it’s very likely they’ll start having deliverability problems.

These spam complaint thresholds have been the standards used in the email industry since the report spam feature was introduced, but Gmail and Yahoo made it clear they will now enforce them.
Keep in mind, a 0.1% spam complaint rate is just one complaint for every 1,000 emails delivered. If you are in between 0.1% and 0.3%, you’re in a “danger zone” and may start seeing more of your messages landing in the junk folder.
The unsubscribe rate (39.5%) and read rates (25.4%) are also engagement signals you can monitor. Read rates help you understand if contacts are actually spending time with your emails instead of just opening and ignoring the contents.
It’s totally normal for people to regularly unsubscribe from your emails. So, you shouldn’t worry too much about this metric as long as it’s below 1%. However, you don’t want your unsubscribe rate to get out of control either. That’s a negative engagement signal, which could suggest to mailbox providers that your messages are unwanted.
The block/reject rate measures the percentage of emails that are rejected by a receiving email servers before being accepted for delivery. This could be due to an improper server configuration, blocklisting, or an authentication failure.
The bounce rate measures the percentage of emails that are initially accepted but later returned as undeliverable. A soft bounce is the result of a temporary delivery failure such as a full mailbox. A hard bounce is from a permanent delivery failure such as an invalid email address.
When your emails are blocked or bounce, it means they never reached the inbox because they were rejected by a receiving mail server or failed to deliver for other reasons. Here’s the difference between the bounce and block/reject rates:
We asked survey respondents how well they’re able to understand and monitor both blocklists and bounces. Results show more than half (52.8%) are not monitoring blocklists for their sending domains and IP addresses while another 14.5% are unsure.
Even if you are running a very clean email program, one small misstep somewhere can cause a provider to put your domain or IP on their blocklist. That’s something you definitely want to be aware of before you start realizing you have a bunch of emails that never got delivered.
A blocklisting happens when a mailbox provider or blocklist service identifies your domain as potentially spammy or malicious. This can happen for a variety of reasons. When you monitor blocklists, you can catch and address problems to avoid having important emails rejected. Remediating the situation often requires contacting the blocklist provider with documentation explaining how you’ve fixed the problem that prompted the blocklisting.
Blocklist monitoring services are a helpful tool that senders can take advantage of in support of reliable email deliverability.
Email bounces can be confusing because there are multiple reasons why an email bounces. When an email bounces, it is returned to the sender with an error message as well as a code that explains the situation. Here are some examples of bounce codes:
• 5.1.1 indicates a hard bounce because of a bad destination mailbox address such as an invalid email.
• 5.2.2 indicates a recipient’s mailbox exceeded its storage limit.
• 4.4.7 indicates a message took too long to be delivered and expired.
While 46% of survey respondents say they can classify email bounces and address the associated problems, just over 30% say they’re unable to do so and nearly 24% are unsure.
Sinch Mailjet users don’t have to worry much about hard bounces. Our platform automatically suppresses email addresses that return a hard bounce. This keeps you from sending to those contacts, but it’s still wise to manually remove them from your list.
This is where many email marketers get confused about measuring deliverability. That’s because there isn’t a metric for measuring overall deliverability. But there is a metric that seems like it should: the delivery rate.
While more than 53% of senders say they actively monitor their delivery rate, most don’t understand what it actually measures. We know this because we snuck a quiz question into our survey.
When asked to select what the delivery rate measure, these were the results:
Since only around 12% of senders know what the delivery rate measures – that means almost 88% do not – and that’s a problem.
More than half of respondents (50.9%) think the delivery rate measures the percentage of messages that reach the inbox, which isn’t true, but it’s a very common misconception. The delivery rate measures the percentage of emails delivered to any folder, which includes spam.
The delivery rate will not tell you what your deliverability looks like. It just tells you the percentage of emails that were delivered. It doesn’t tell you if emails landed in the inbox, or the spam folder, or any specific tab in the inbox.
Let’s reiterate that fact just to be sure… When emails land in spam, they still count toward your delivery rate. Good deliverability means reaching the inbox. So, the delivery rate is definitely not an overall metric for email deliverability.
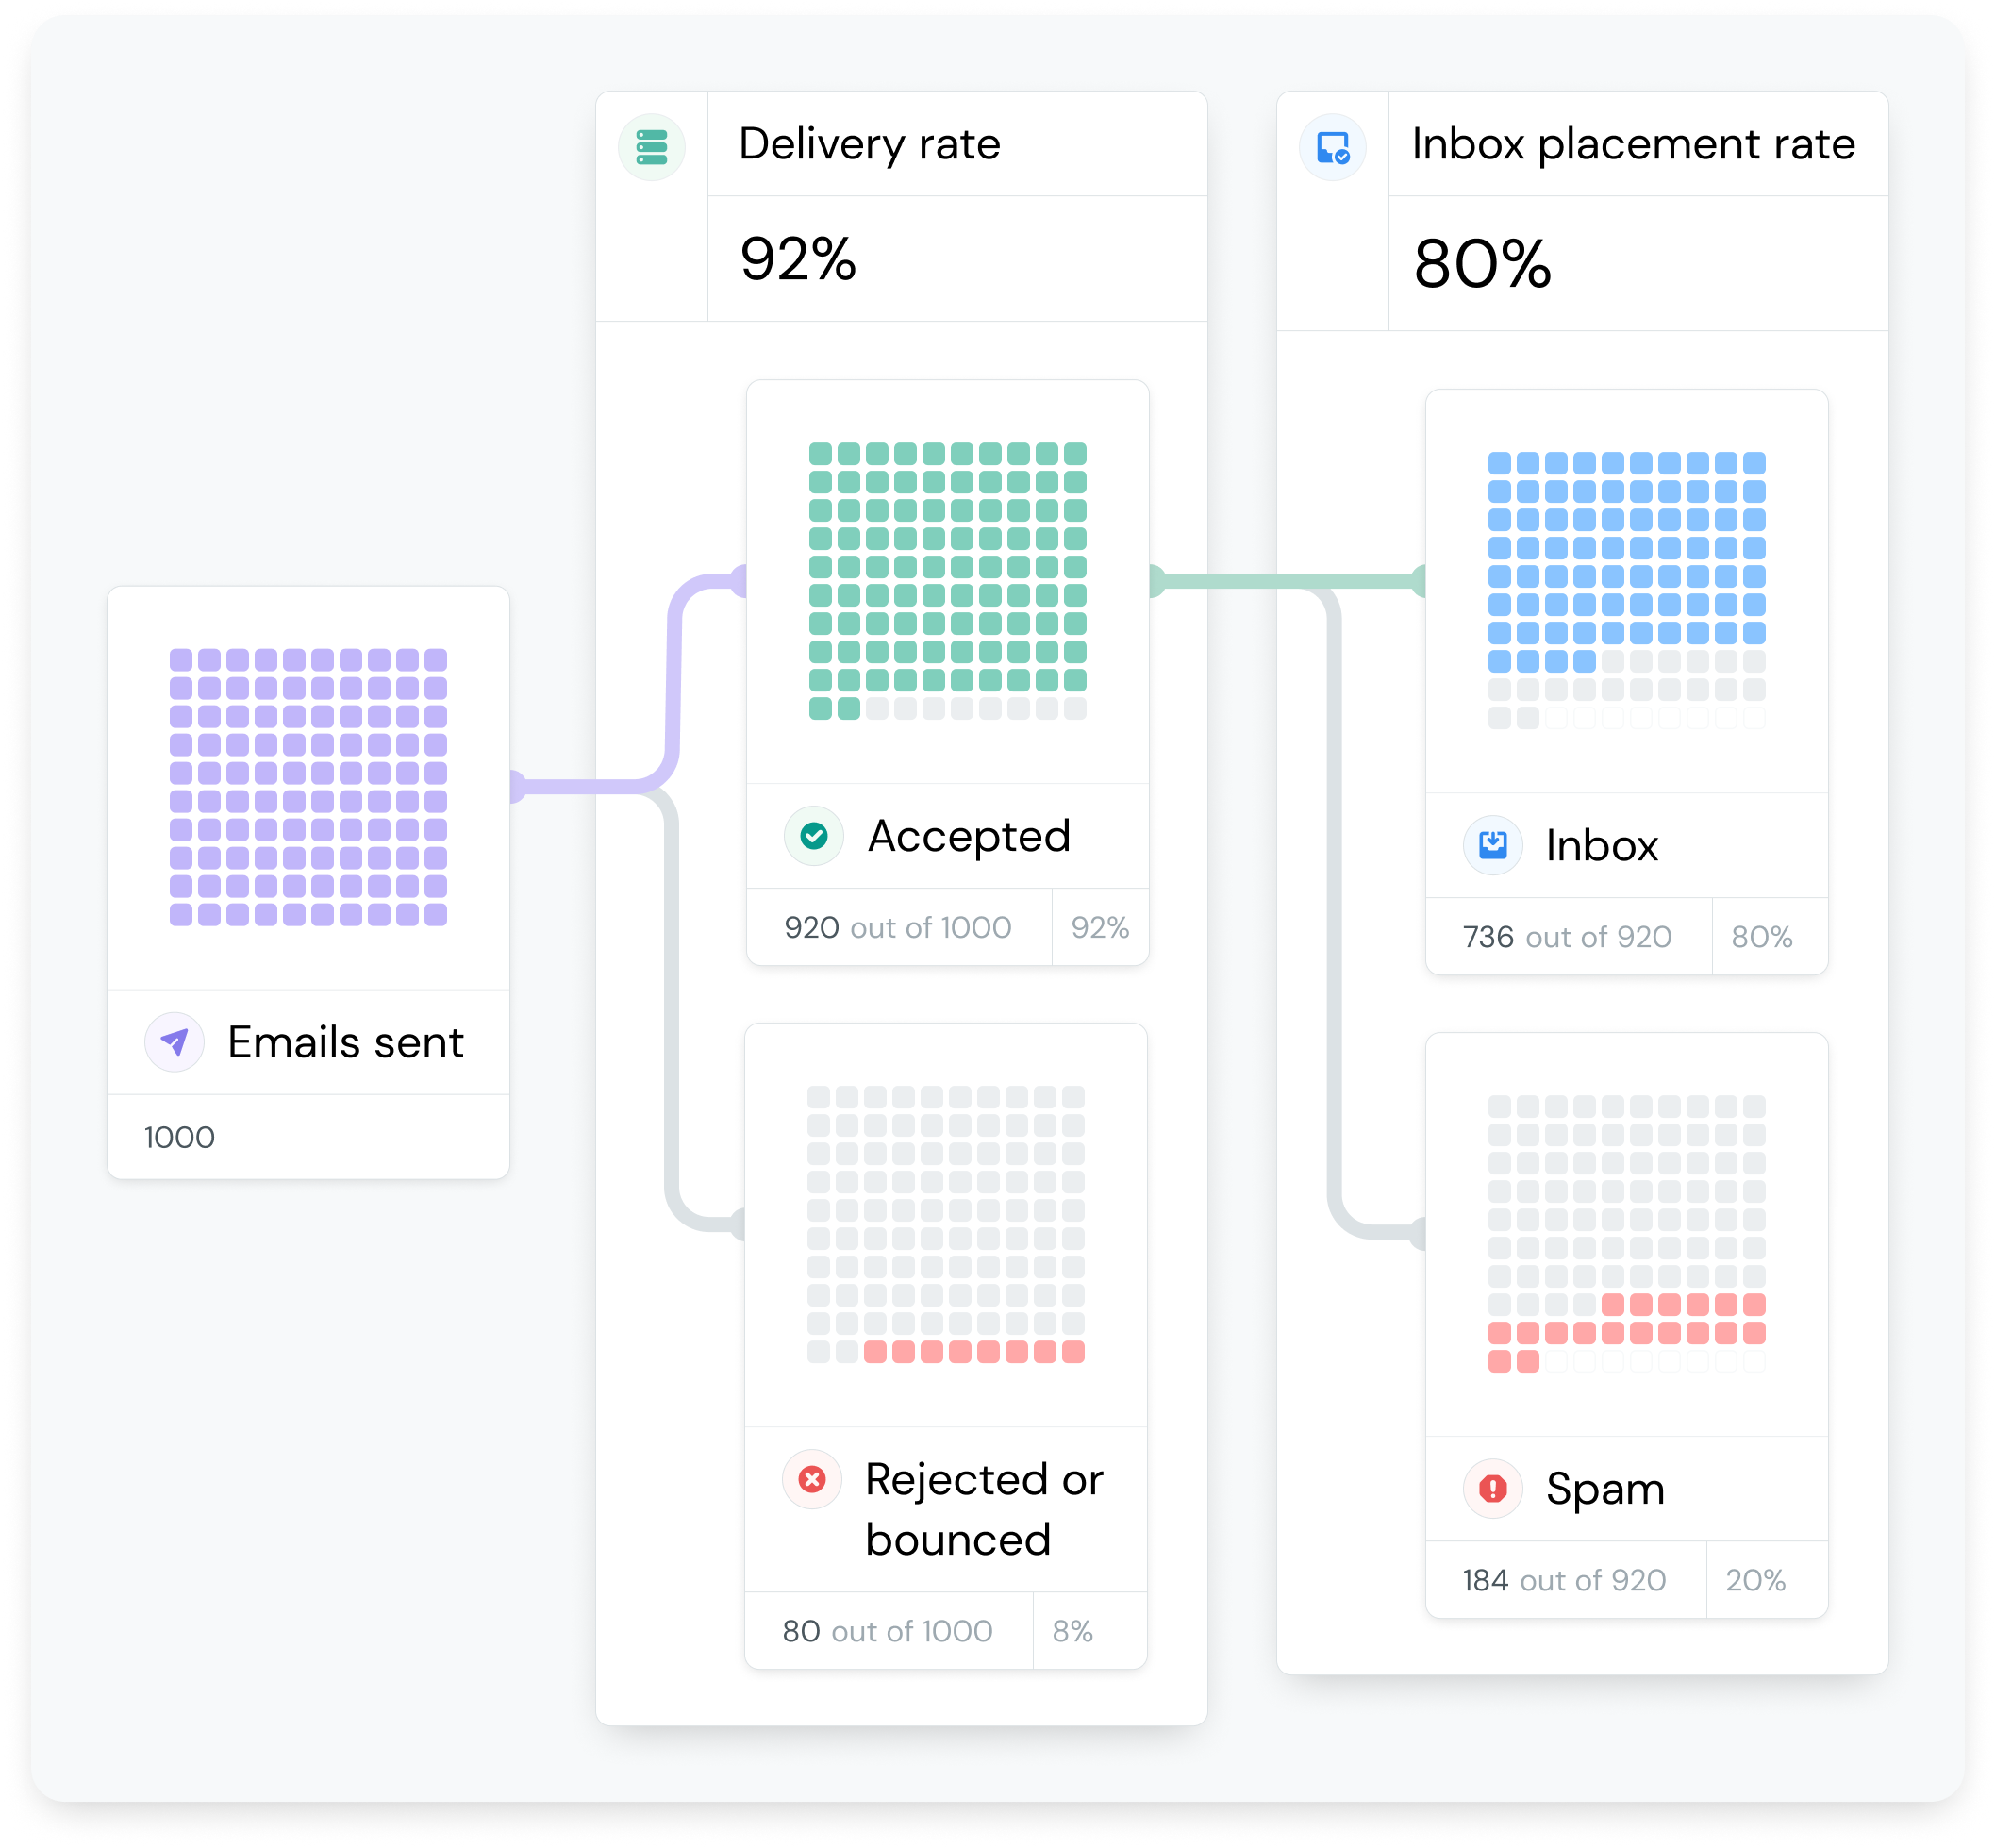
The best way to measure overall deliverability is by calculating an inbox placement rate. Here are the two formulas for the delivery and inbox placement rates:
(Emails delivered ÷ Emails sent) x 100 = Delivery rate
(Emails in the inbox ÷ Emails delivered) x 100 = Inbox placement rate

Technically, it is not possible to know the exact percentage of emails that reach inboxes. The inbox placement rate is a prediction that estimates the percentage of messages you can expect to reach the inbox. Rather than learning your inbox placement rate after emails are sent, you run a deliverability test before launching campaigns.
Inbox placement testing, also known as seed testing, is the method used to determine an inbox placement rate. When a test is conducted, an email is sent to a variety of seed mailboxes from different providers, including Gmail, Outlook, Yahoo Mail, and more. All of these services have their own filters and rules for what reaches the inbox and what ends up in spam.
Because you or a technology partner own these seed mailboxes, it’s possible to see where each email lands. The results are ultimately delivered back to the sender in an inbox placement report.
Here’s how it works, step-by-step…
Step 1 – Send a test email to a list of seed mailboxes:
You or a partner own this list, and it will include major providers (Gmail, Yahoo, Outlook, etc.) Receiving mail servers filter the test email based on numerous factors.
Step 2 – Monitor email delivery:
Track where the test email ends up in each seed mailbox. Inbox? Spam/junk? Promotions tab? Blocked?
Step 3 – Analyze results and adjust:
Review the results of your inbox placement report. If there are issues, identify what you may need to change to improve deliverability.
A few years ago, you sent out an email blast and just sort of hoped it landed in the inbox. Maybe you sent it ahead of time to yourself and a few coworkers to see where it would go. But that’s not an accurate picture because you’re sending to your own internal environment. With inbox placement testing, you get a more unbiased view of where your messages will be landing.
While it is possible to conduct manual inbox placement testing, a platform that provides this service will have a larger variety of reliable mailboxes with different configurations. A deliverability suite like Mailgun Optimize also provides actionable advice for making adjustments based on the results of your report.
Inbox placement tests may also be able to tell you where your emails land within the main inbox. That could include Gmail’s Promotions tab or tabs for Updates and Social. Apple Mail introduced a similar tabbed inbox in 2024.
Promotions tabs (as well as other inbox tabs) are part of the main inbox and should be viewed as a successful delivery. The reality is, if you’re sending promotional emails, then the Promotions tab is a very logical place for your emails to end up.
Perhaps the biggest concern for email marketers is that campaigns in the Promotions tab will be ignored. However, consumer research from The path to email engagement report shows that’s unlikely.
Nearly 75% of consumers we surveyed in 2024 said they check their Promotions tab at least once per week with more than half checking it daily. If they are checking that tab, they’re probably on the lookout for promotions. That means they’re more likely to be actively interested in what you’re offering.
While deliverability can sometimes feel mysterious, with the right tools and a better understanding of the right metrics you’ll be able to solve all sorts of email mysteries.
Inbox placement testing is a powerful tool for uncovering insights into where your emails are likely to land. Yet, even though our survey found avoiding spam is the biggest deliverability challenge, just 13.3% of senders use inbox placement reports.
Typical email service providers (ESPs) don’t often provide this type of testing, but it represents an opportunity to enhance and improve your email program, maximizing your reach and squeezing all the potential out of email communication.
If you really want to know what happens to your emails after you hit send, inbox placement tests are the best way to find out.